Create Tree-Map Chart
Create Tree-Map Chart: This video contains how to create Tree-Map Chart in OPNBI.
![]()
Click on hamburger icon.

Click on dashboard tab and Open variable Radius Radar Chart in edit mode.
The Edit menu box appears as you click on variable Radius Radar chart icon. And a widget gets added in content place automatically in dashboard.
Click on Create After entering Dashboard Name in dialog box.

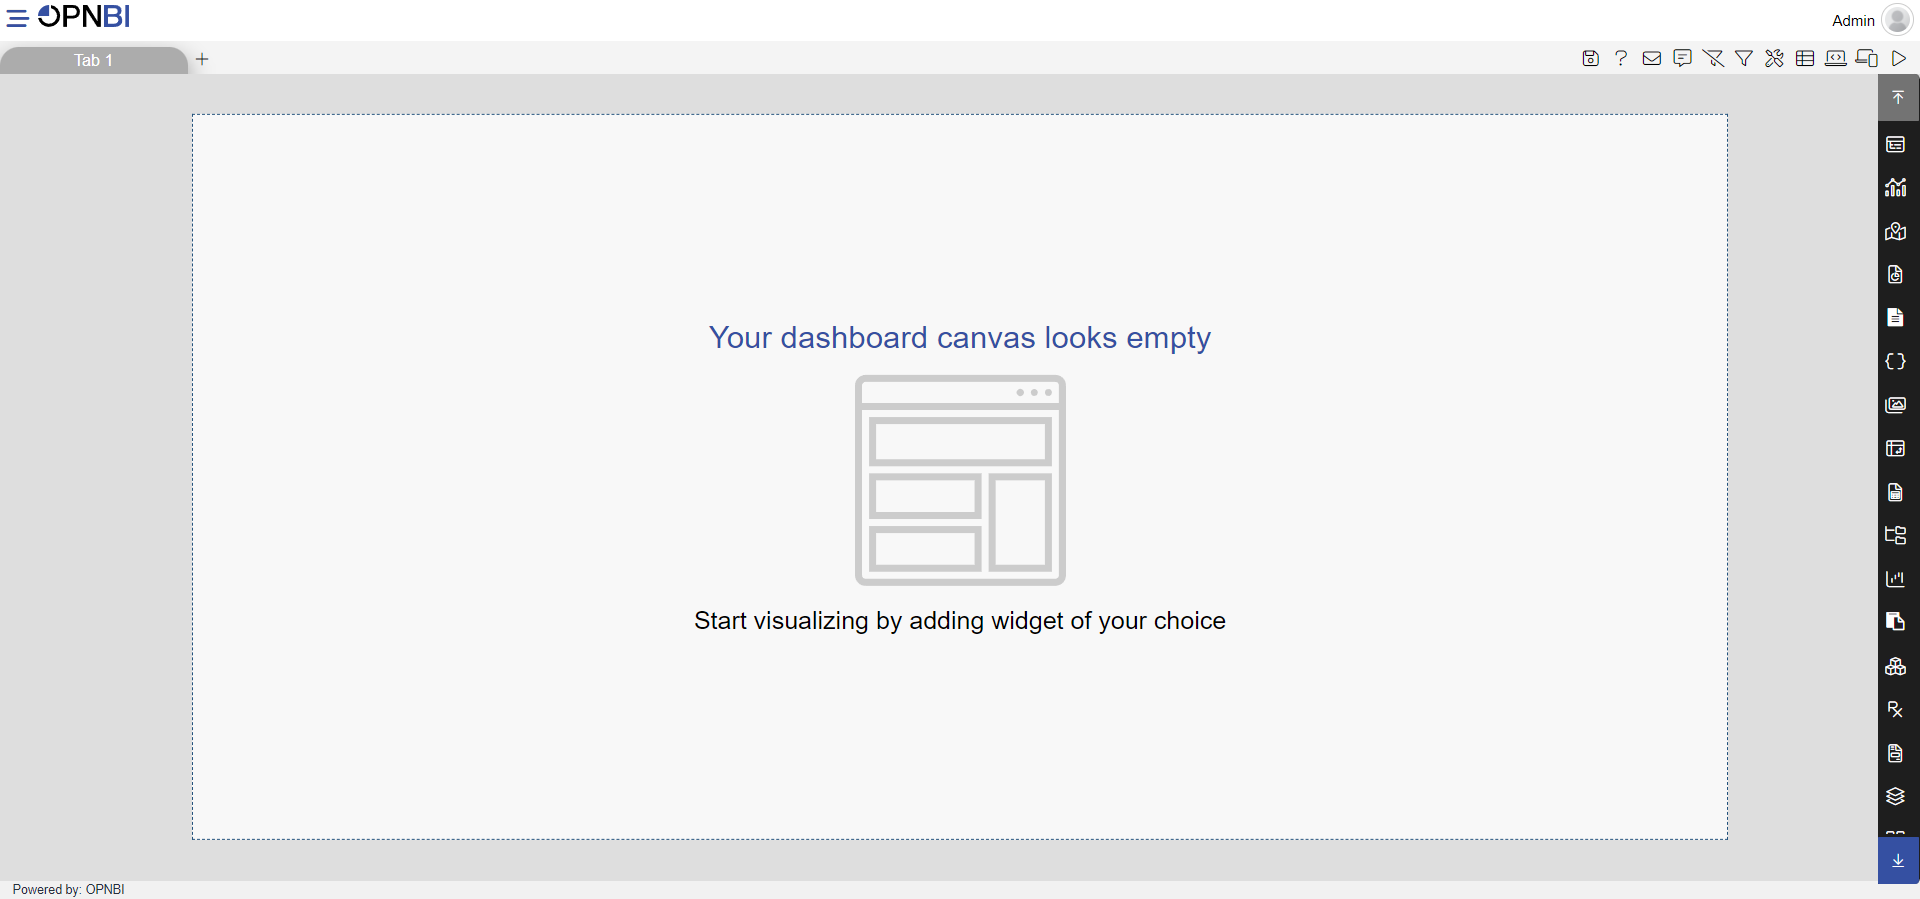
You will see an Empty Dashboard, As shown in figure below:
From Right Vertical Menu Select the Chart Widget icon. And Click on Other Chart and select Tree Chart.
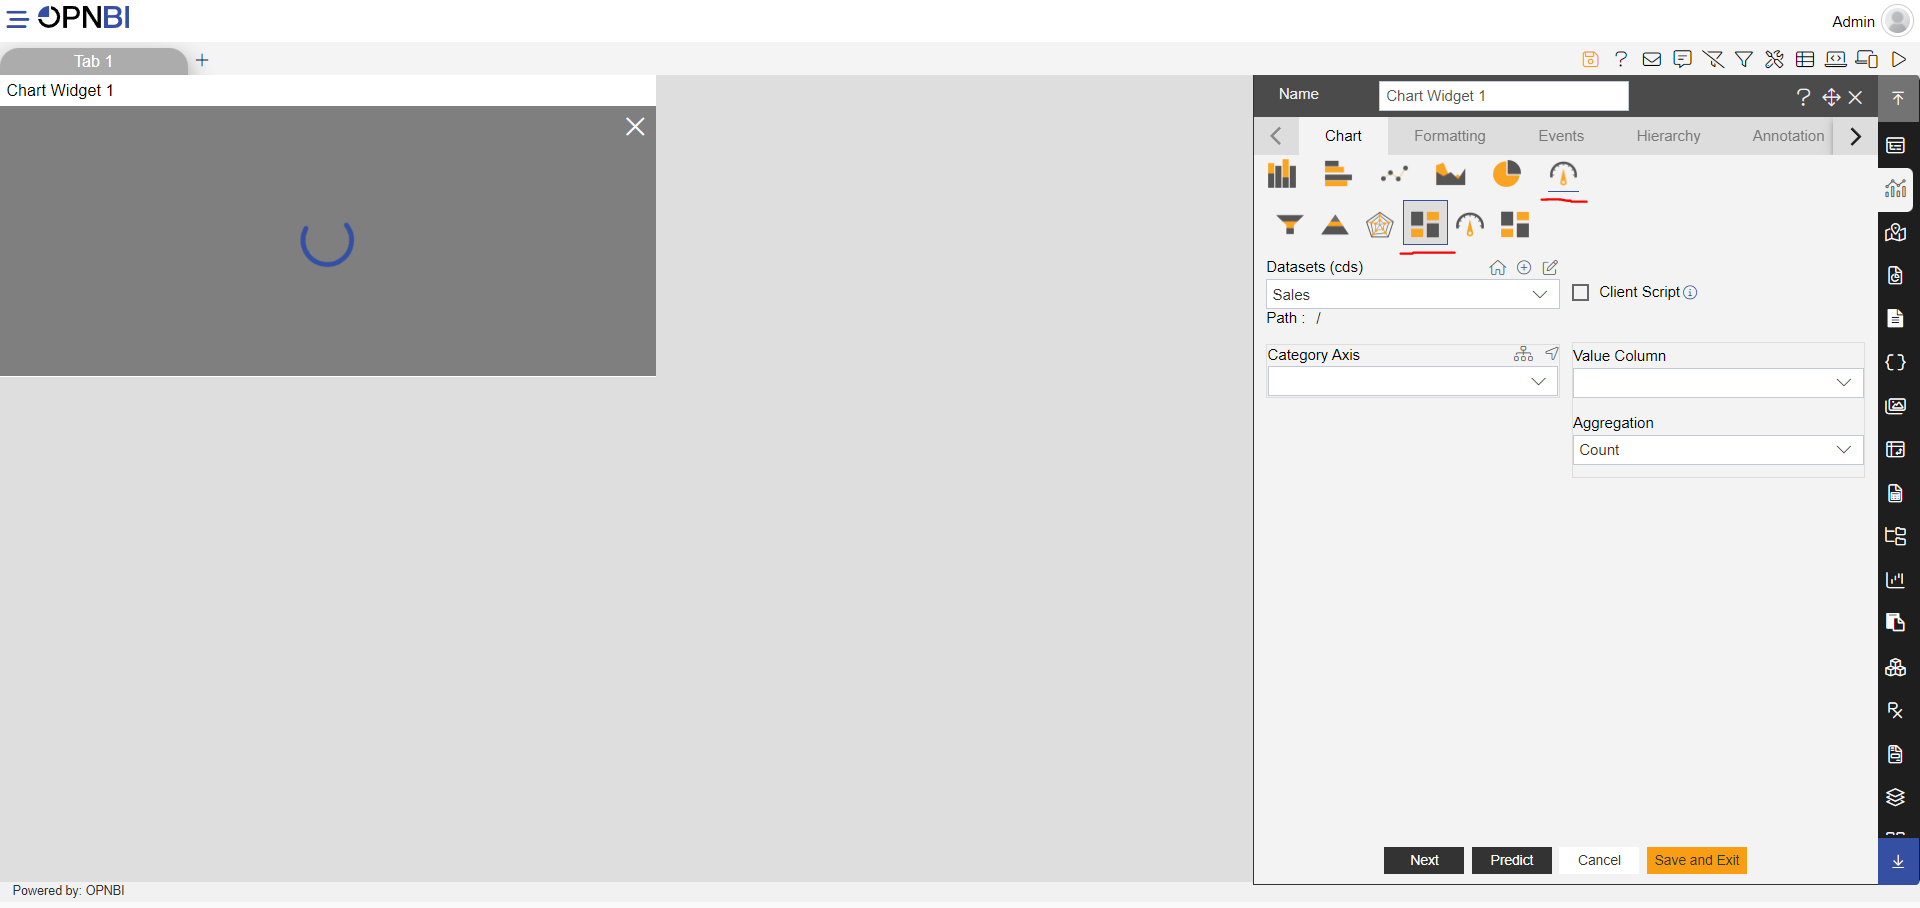
The Edit menu box appears as you click on Tree Map icon. And a widget gets added in content place automatically in dashboard, As shown in Figure below:
We have selected the Sales.CDS in here.
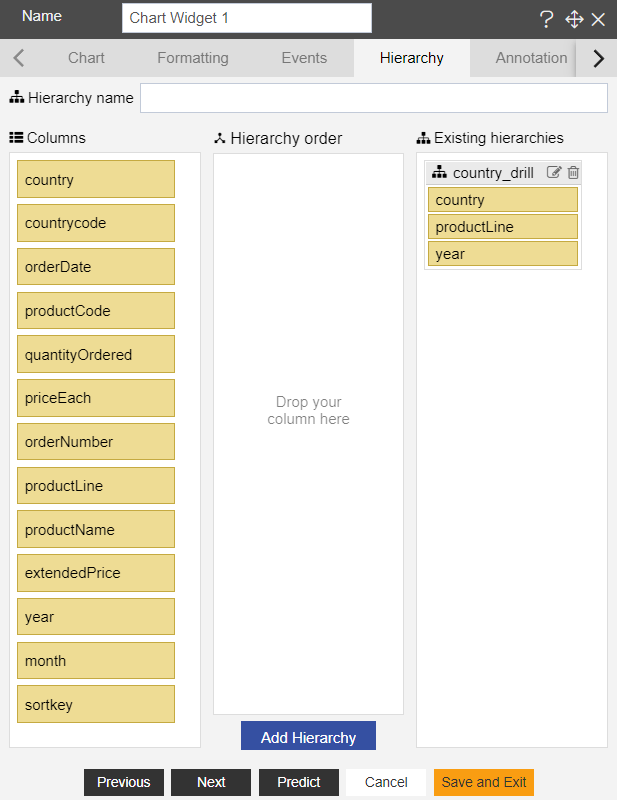
- Enter Following details in Hierarchy Property:
- Drag and drop: Country, Product Line and Year.
Click on Add Hierarchy button As Shown in below Figure.
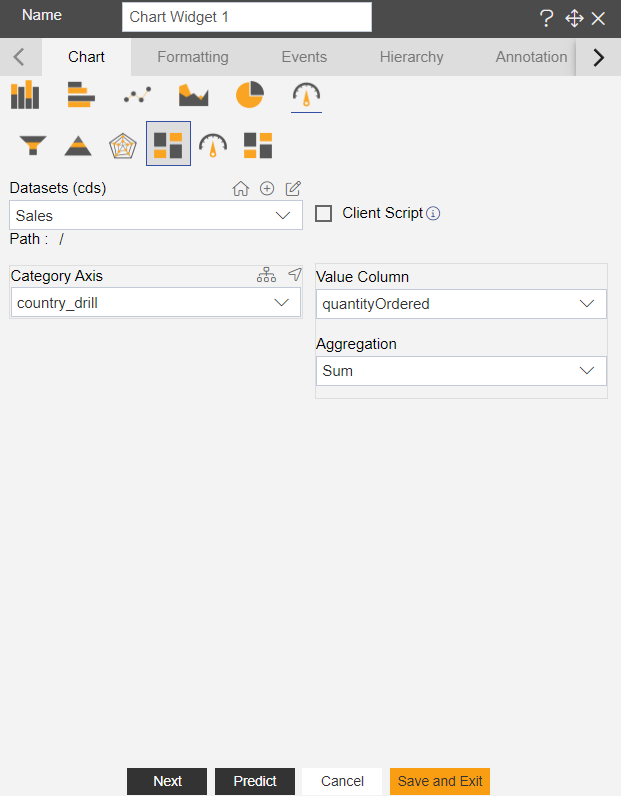
Enter Following details in chart controls:
- Dataset: Sales.CDS
- Category Axis: country_drill
- Value Column: quantityOrdered
- Aggregation: Sum
Fill above details in edit box, As Shown in figure:
Click on Preview and Save and Exit.
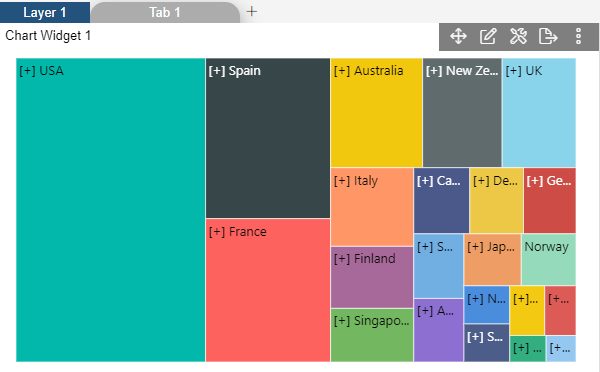
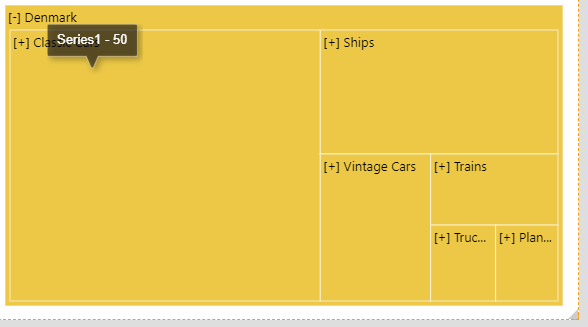
Now, match your Tree Map with the below example, it should look like the figure below:
In order to understand in detail about other features, click on the following links:-